Welcome to this new article in our Playwright Testing Tutorial. In the previous article, we covered how to use test.describe() to group Playwright tests and ran the test using command line. Although, running the tests from CLI is the most common and CI-friendly approach, it’s not always the most convenient option – especially when we are writing and debugging the tests locally.
During this local development phase, it’s much easier and faster to run the tests from the code editor itself – Visual Studio Code in this case. In this article, you will learn how to run Playwright tests from VS Code – along with some important execution and debugging options available within the editor.
Install Playwright Test for VSCode Extension
In order to run Playwright tests directly from VS Code, the first step is to install the official Playwright Test extension. Follow the steps given below to install this extension for Visual Studio Code –
1) Open Visual Studio Code
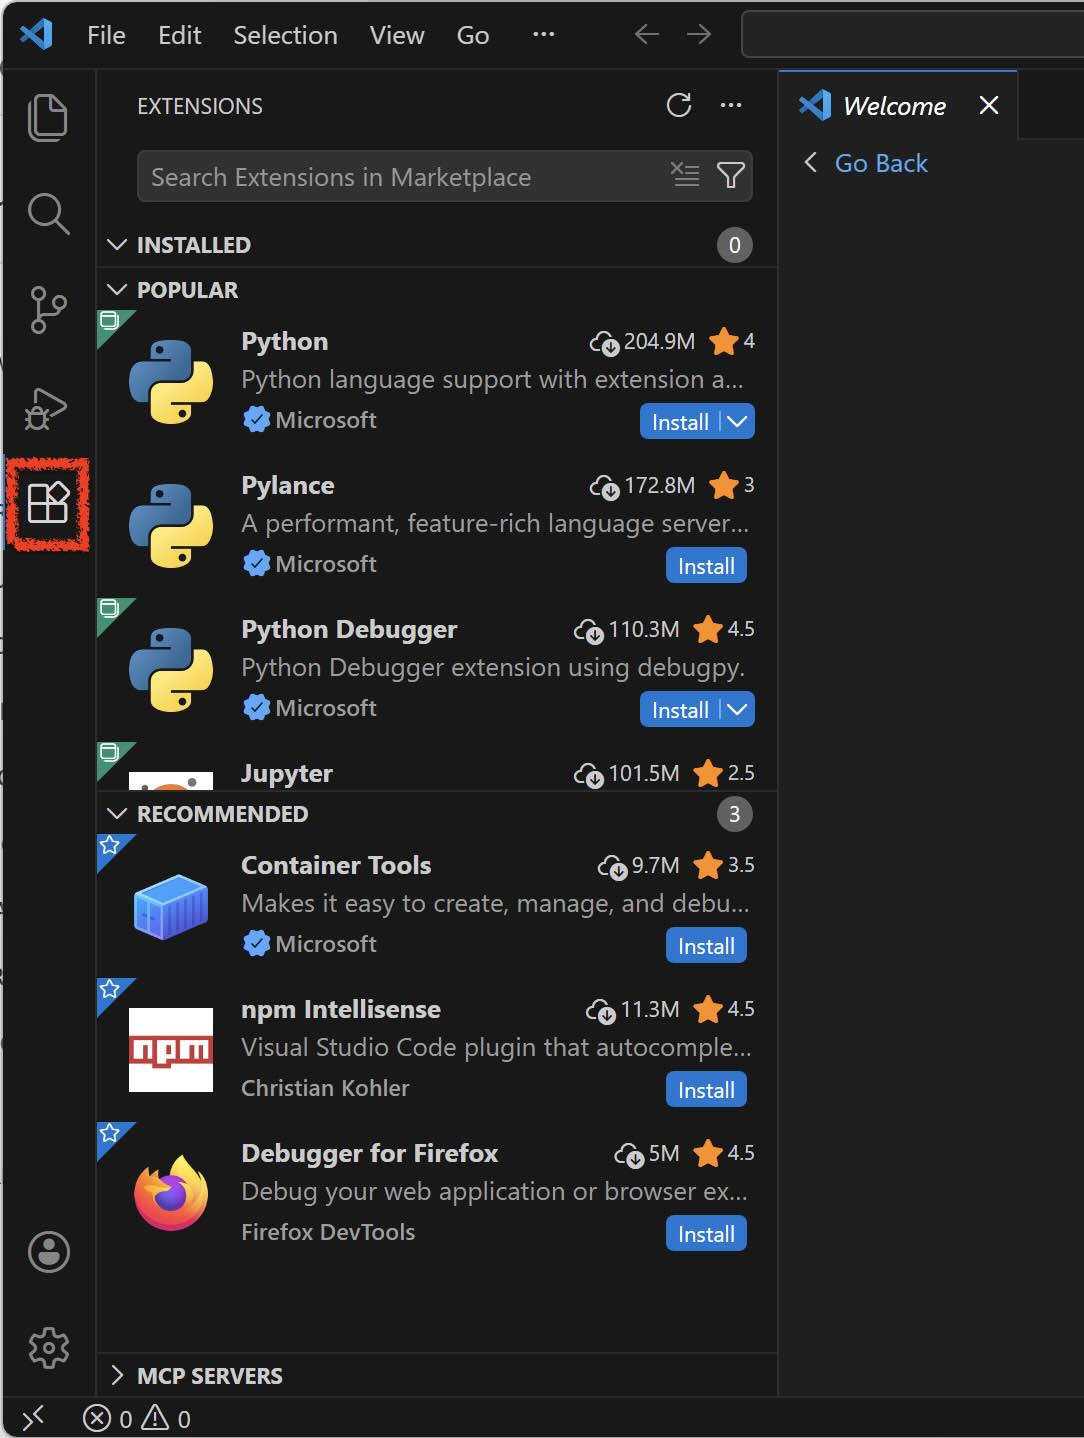
2) Click on the Extensions icon from the left sidebar (or press Ctrl + Shift + X on Windows / Cmd + Shift + X on Mac). Extensions section will be displayed
3) In the search bar, type Playwright Test and select the official extension published by Microsoft
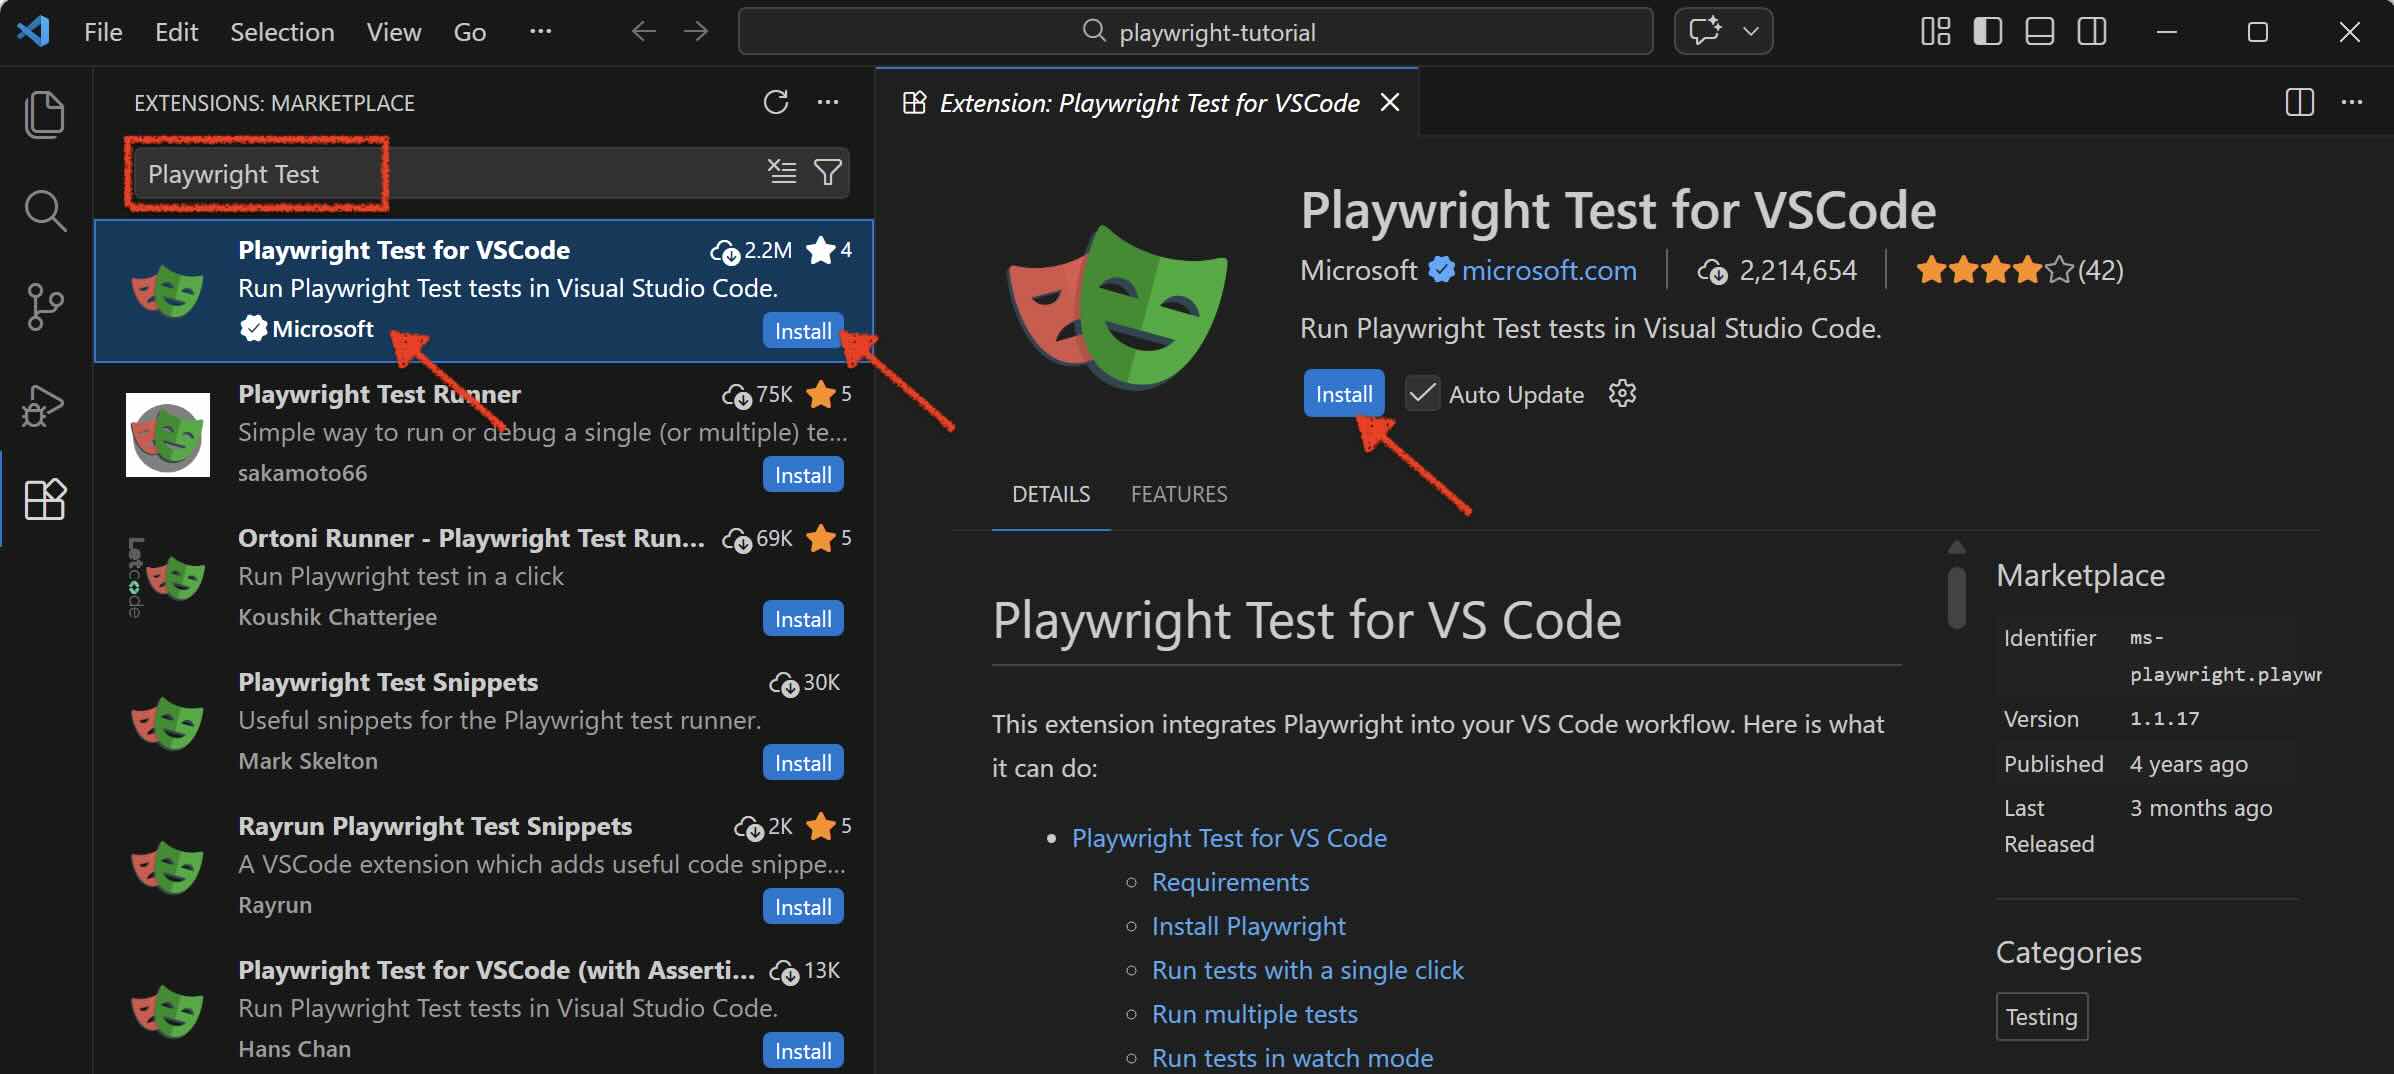
4) Click on Install button. Once installed, you should see the Testing (beaker) icon appear in the left sidebar
This completes the installation process. Once the extension is installed, VS Code will be able to automatically detect tests in your playwright project. In the next section, we will verify this by exploring the Test Explorer and the run options that appear directly inside your test files.
Verifying VS Code automatically detects tests in our Playwright project
As we mentioned in the end of the previous section, once you install the Playwright Test extension, VS Code automatically detects the existing tests that you have in your Playwright project. This extension also provides you with different options to run and debug these tests directly from Visual Studio Code. Lets see how this works –
Check existing tests in Explorer section
First of all, click on the Explorer icon from the left sidebar (or press Ctrl + Shift + E on Windows / Cmd + Shift + E on MacOS). Make sure you have opened the Playwright-Tutorial project. Now expand the tests folder. As of now, you should see the following 2 spec files in the tests folder –
- example.spec.ts
- flight-search.spec.ts
Open flight-search.spec.ts. You will notice green run icons to the left of test.describe() and each individual test() block as well.
Note: If you click the Run icon next to test.describe(), VS Code runs all the tests inside that describe block. And if you click the Run icon next to an individual test() block, VS Code runs only that specific test.
Now open example.spec.ts file. Here also, you will notice green run icon next to each individual test() block.
Running Tests from Explorer section
Go ahead and click on Run icon next to the first test() in example.spec.ts. While the test is running, you will be able to notice the following points –
- Browser window does not launch during the execution (this means the test was run in headless mode)
- The Test Results section shows that the test runs only on the Chromium browser
At this point, you might wonder:
We did not explicitly specify headless mode or choose Chromium – so how did VS Code decide to run the test this way? You can find the answer in the Testing section (Beaker icon) in VS Code.
Selecting browsers and running Playwright tests visually in headed mode
Click on the Testing icon (Beaker icon) in the left sidebar and scroll down to the Playwright section. Under Projects, you will notice that only Chromium is selected by default. No other browsers are enabled. Also check the Settings section, where Show browser is unchecked.
This explains the earlier behaviour where – the test ran only on Chromium and was executed in Headless mode.
To verify this, select both Chromium and Firefox under Projects. Then, enable the Show browser option in Settings. Now go back to the Explorer section and run the same test again. While the test is running, observe how:
- The browser window launches (headed mode)
- The test executes on both selected browsers
Other ways to run Playwright tests in VS Code
In addition to running tests from the Explorer section – which we covered in the last section – VS Code provides a few more convenient ways to execute Playwright tests directly from the editor. Lets have a quick look at couple of these options –
Run Tests from the Test Explorer
Click on the Testing icon (Beaker icon) in the left sidebar to open the Test Explorer. Here you will see all the tests detected in your Playwright project. You can expand the tests section to view each spec file. You can further expand the spec files to view the individual tests. From this panel, you can:
- Run all tests (by clicking on run icon next to the tests section)
- Run an individual spec file (by clicking the run icon next to the spec file)
- Run a specific test (by clicking on run icon against an individual test)
Run Tests Using Right-Click options
You can also run tests directly from within the test file. Go to Explorer section, and open a spec file (for example, example.spec.ts) and right-click inside the editor. VS Code will display several Playwright test execution options, such as:
- Run Test at Cursor – runs the test where your cursor is currently placed
- Run Tests in Current File – runs all tests inside the open spec file
These shortcuts are particularly helpful when you are actively writing or debugging tests.
More features in the Testing panel
The Testing section in VS Code provides many additional capabilities for working with Playwright tests. For example, you will find options such as:
- Record new test
- Show Trace Viewer
- Other debugging and execution tools
We will explore these features in more detail in the upcoming articles of this Playwright tutorial series.